Yet Another Searchable Property Price Register

Last Sunday, the Residential Property Price Register was launched.  Since I’m keeping an eye out for something to buy, I was fascinated by the details it contained.  But the search options were limited and there was no map.  However, the data was downloadable as a trio of CSV files.  So Yet Another Searchable Property Price Register was born.

I dumped all three files into a MySQL db, slapped a PHP script in front of it for searching and another to geocode the addresses and used Twitter bootstrap to give it a bit of spit and polish.  All in all it was a few hours work and another few hours to get the data geocoded.  It really leads me to ask what problems were encountered that resulted in it taking two years for the data to appear online.

If you want to have a look at the code or raw data, you can visit the repo on GitHub.  You’ll see a friend of mine, Mike McHugh has already helped make my rough version all the better.  I’ve included the database so people can submit improvements to the data.

Of course, it was such a good idea other people had it as well. They all put their own search interface onto the data and some did a few more interesting things.  The ones I’ve found so far are:

The head of the Property Services Regulatory Authority, Tom Lynch is quoted in an article in the Sunday Times (Home Truths, page 10 on 7/10/2012 – behind a paywall so I’m not bothering to link) as saying the don’t have additional information like square footage, number of bedrooms and other details that would truly make the information useful.  Yet Daft.ie’s version does just that using the data they have on hand.  Surely an interface could have been built for registering the houses that asked for these details (as well as actually validating the data and avoiding clangers like ‘Gawlay‘) when submitting for stamp duty.

It also seems odd that the official version didn’t consider mapping the data.  Even if they didn’t ask for the location when gather the data, services like Google’s Geocoding API (which I used) are available.  While not perfect,  it gives reasonable results most of the time.

It’s great to have the data, but there’s a lot more information that would give context and enhance what’s there.  Hopefully the criticisms  and improvements made by 3rd parties will be taken on board and a much improved version will appear in the near future.

Hopefully someone will find this useful and I’ll be updating the database as more data becomes available.

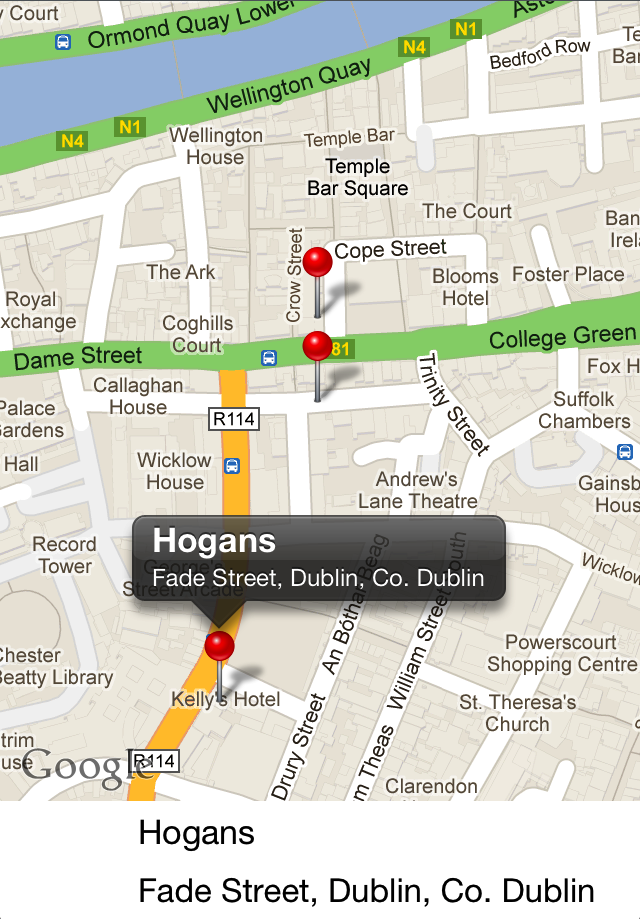
A Sunday Afternoon Project: KMMapList

I’ve been toying with the idea of doing another version of the Pint of Plain app and one of the things I want to change is list of bars you first see when you open the app. During the week I ended up on Dribble and saw a screenshot from an app called Chow Now.
What I liked about this is that the extra detail about the restaurants is present at the bottom where’s there’s more room to breath.  It’s a nice combination of the now traditional map and list views.  I’m guessing that tapping a pin will make the scroll view move and swiping the scroll view highlights the pin.  The details at the bottom are far more detailed than a normal call out and there’s enough room to have the phone number tapable as well as leading to a more detailed view.

Now I’m sure this will be easy to build with [REDACTED] in iOS 6, but I want something I can use now as other wise it’s an idea that would lie rotting in my brain.  I also wanted to play with reusable UIViews built with Interface Builder as a test for a couple of future app ideas.

I’ve a first pass of my code in a repo on GitHub  and I’ll probably be poking at it a bit more over the next few weeks.  For something that I kicked about for a couple of hours today the core of it is there and I’m happy enough with the result.  It’s not as pretty as the example from Dribble, but that was never going to happen with my cack handed design chops.

Functionally there but just not pretty

There’s probably quite a few improvements that could be done to the current code (apart from the obvious hard coding of the data points).  It’d probably be better if the off screen views were generated just in time rather than all at once and I’ve still to figure out how it’ll handle a large number of annotations.  Still, it’s a good proof of concept and worth moving along.  We’ll see how it goes over the next little while.

A Sunday afternoon project: Providing App Store stats via JSON

Last month Apple announced their auto-ingest tool for fetching the download and update statistics for apps.  The tool downloads the stats for a particular day or week as a gzipped CSV file that you can then process yourself.  This is far nicer than having to try and scrape the numbers from the iTunes Connect page although the daily numbers are still restricted by a two week limit and the weekly by 13 weeks.  Hopefully in the future you’ll be able to retrieve further into the past (assuming the data still exists).

I’d a bit of free time this weekend and decided to have a poke at this and see if I could  grab the data and present it in a easily consumed format (i.e. JSON).  Another reason for looking at this is because I have two iPhone Developer accounts and it’s be nice to see the data from both as one graph rather than having to log in and out.

To that end I wrote a couple of lumps of PHP to ingest and process the stats which is available on GitHub (https://github.com/kmonaghan/itunes-connect-auto-ingest).  There’s a couple of small steps to get it all to work.

First, create a database (or just use an existing one) and create the table in schema.sql.

Next, edit boot.php.  Here, you need to put in your database details and the details for each iTunes Connect account you have.  To do this you need to put in an array with the following key pairs:

array('username' => 'iTunes Connect username',
'password' => 'iTunes Connect password',
'vndnumber' => 'VND number',
),

The username and password are the details you use to log into iTunes Connect.  You’ll find the VND number if you log into iTunes Connect and go into ‘Sales and Trends’.  It’s the number beside your name at the top left of the screen.

Update: From the comments, this is how you find the Vendor ID (VND):

Choose Sales and Reports.

Choose “Reports” from the top left menu (Where default is “Top Content”).
From the form that will be shown, choose monthly report and download.
The downloaded file will be of format S_M_(VendorID)_TIMEPERIOD.TXT

You can have as many of these accounts as you want and the ingest script will check each one.

Now all the details have been set up, you can ingest the data from Apple.  This is done by simply running ingest.php.   If it’s the first time the script has been run, it will look back 14 days.  Otherwise, it will look in the database for the last successful day there was an import and attempt to import all days since then.  After your first import, you should create a cronjob to run this script once a day to capture the latest stats.  If the downloaded tar files are 0 bytes, check your login details and VND number.

Once all the data is in the db, we can view it via daily.php which outputs the results as JSON.  This will by default output the total number of units downloaded for all apps in the last month.  It can take four parameters:

  • apple_identifier: A particular app identifier.
  • product_type_identifier: This can be 1 (default) which is downloads or 7 which is updates.
  • from: The date to get the stats from.  Expected as dd/mm/yyyy.  Defaults to 32 days ago.
  • to: The date to get the stats to.  Expected as dd/mm/yyyy.  Defaults to yesterday.

And that’s that!  There’s some Javascript in stats.html which consumes the JSON and uses the Google Chart Tools to display the results.  An example of some live data using my own apps is available here.

This is very much a works-for-me lump of code, so it may not do exactly what you want but it should be easily extendable to provide exactly what you want.  It will certainly not cover every error condition.  I’ll probably add bits and pieces to this as I think of a stat I want to visualise or I come across a bug unexpected feature.

Something I might consider looking at in the future is writing a clone of the iTC Mobile app that utilises the saved data.  It’d be a nice little project to try out Core Plot.